
My Role
Led AI-first UX design for test automation dashboards supporting engineers across global labs
Company
Keysight Technologies
Industry
Hardware
Instrument
Testing
Context
At Keysight Technologies, I designed for unified test automation workflows at scale.
Keysight’s test automation platform supports engineers running complex tests across distributed instruments and global labs. These workflows generate large volumes of data that teams rely on to monitor system health, debug failures, and make time-sensitive decisions. The dashboard plays a critical role in how quickly teams can act on this information.
Context
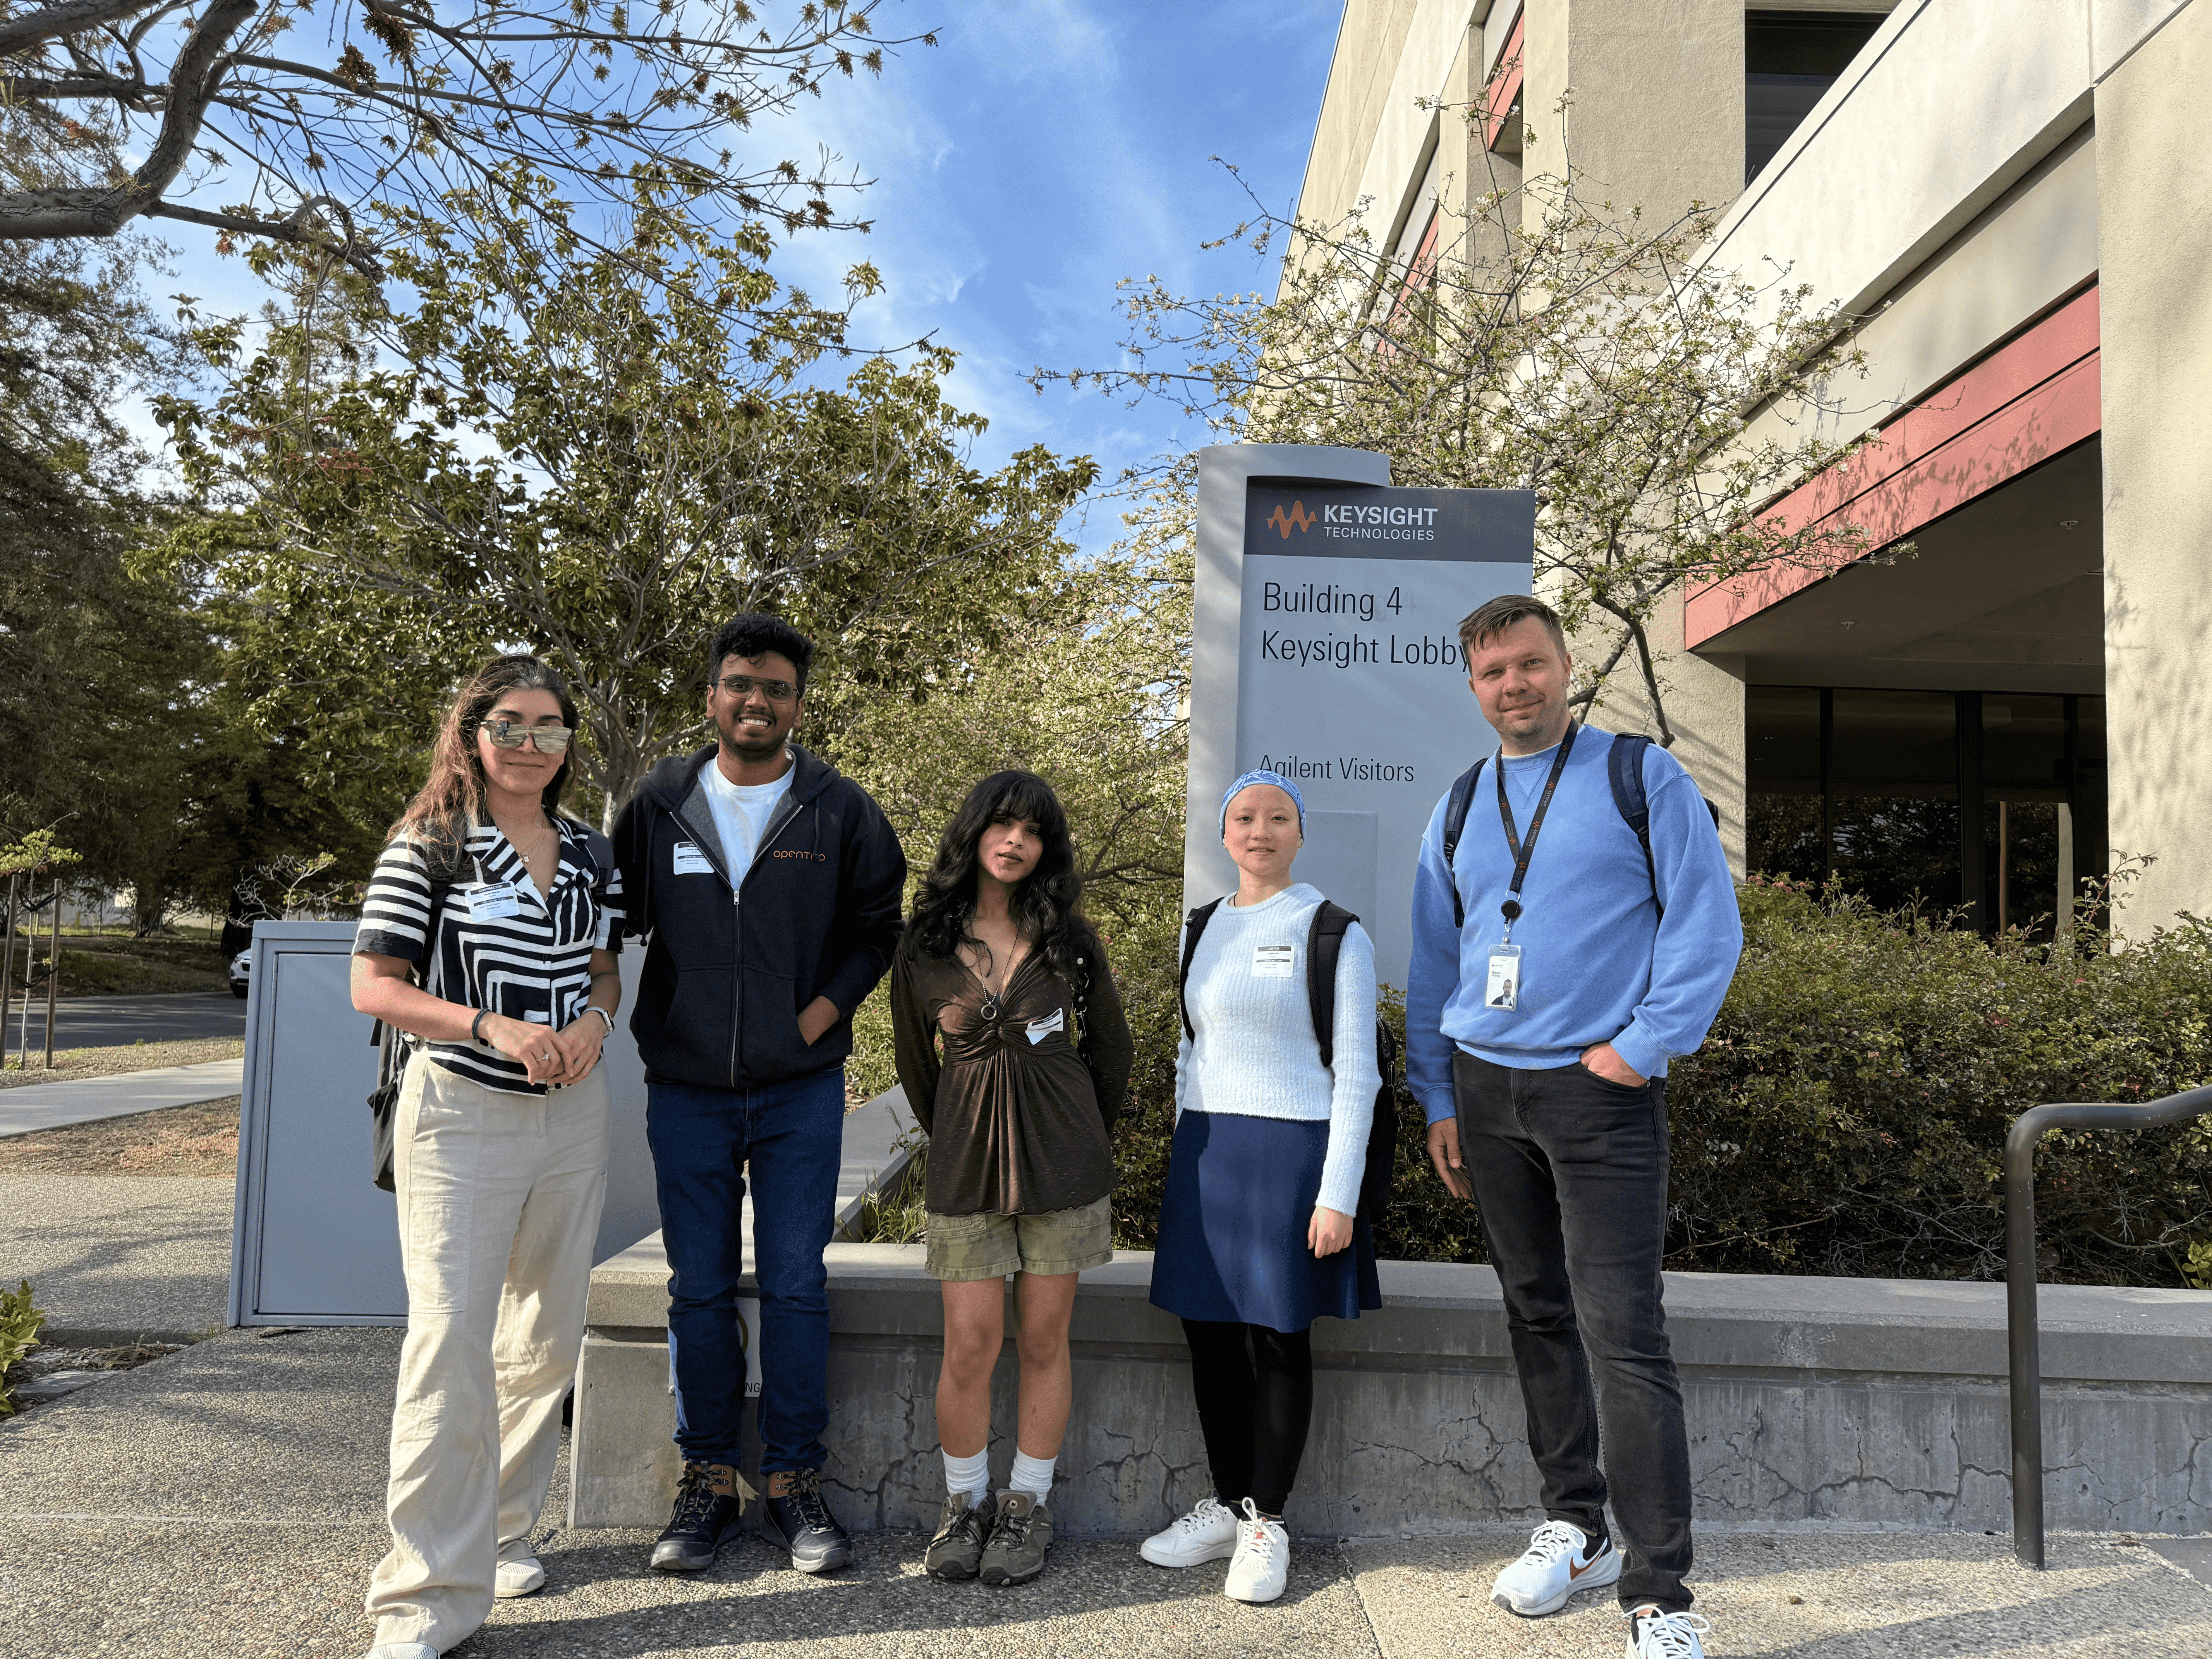
My Team at the Keysight Office
Context
Test automation relies on precise coordination across instruments, schedules, and global labs.
A single delay or missed signal can stall test cycles and block downstream decisions. Teams work across time zones, making real-time visibility and reliable handoffs essential. The dashboard needed to support coordination, not just data monitoring.
Problem
Engineers had data, but lacked clarity on status, failures, and next steps.
The existing dashboard surfaced large amounts of information without clear prioritization. Error states were hard to interpret, important signals were buried, and users often had to switch tools to gain context. This slowed decision-making and increased manual effort.
Problem
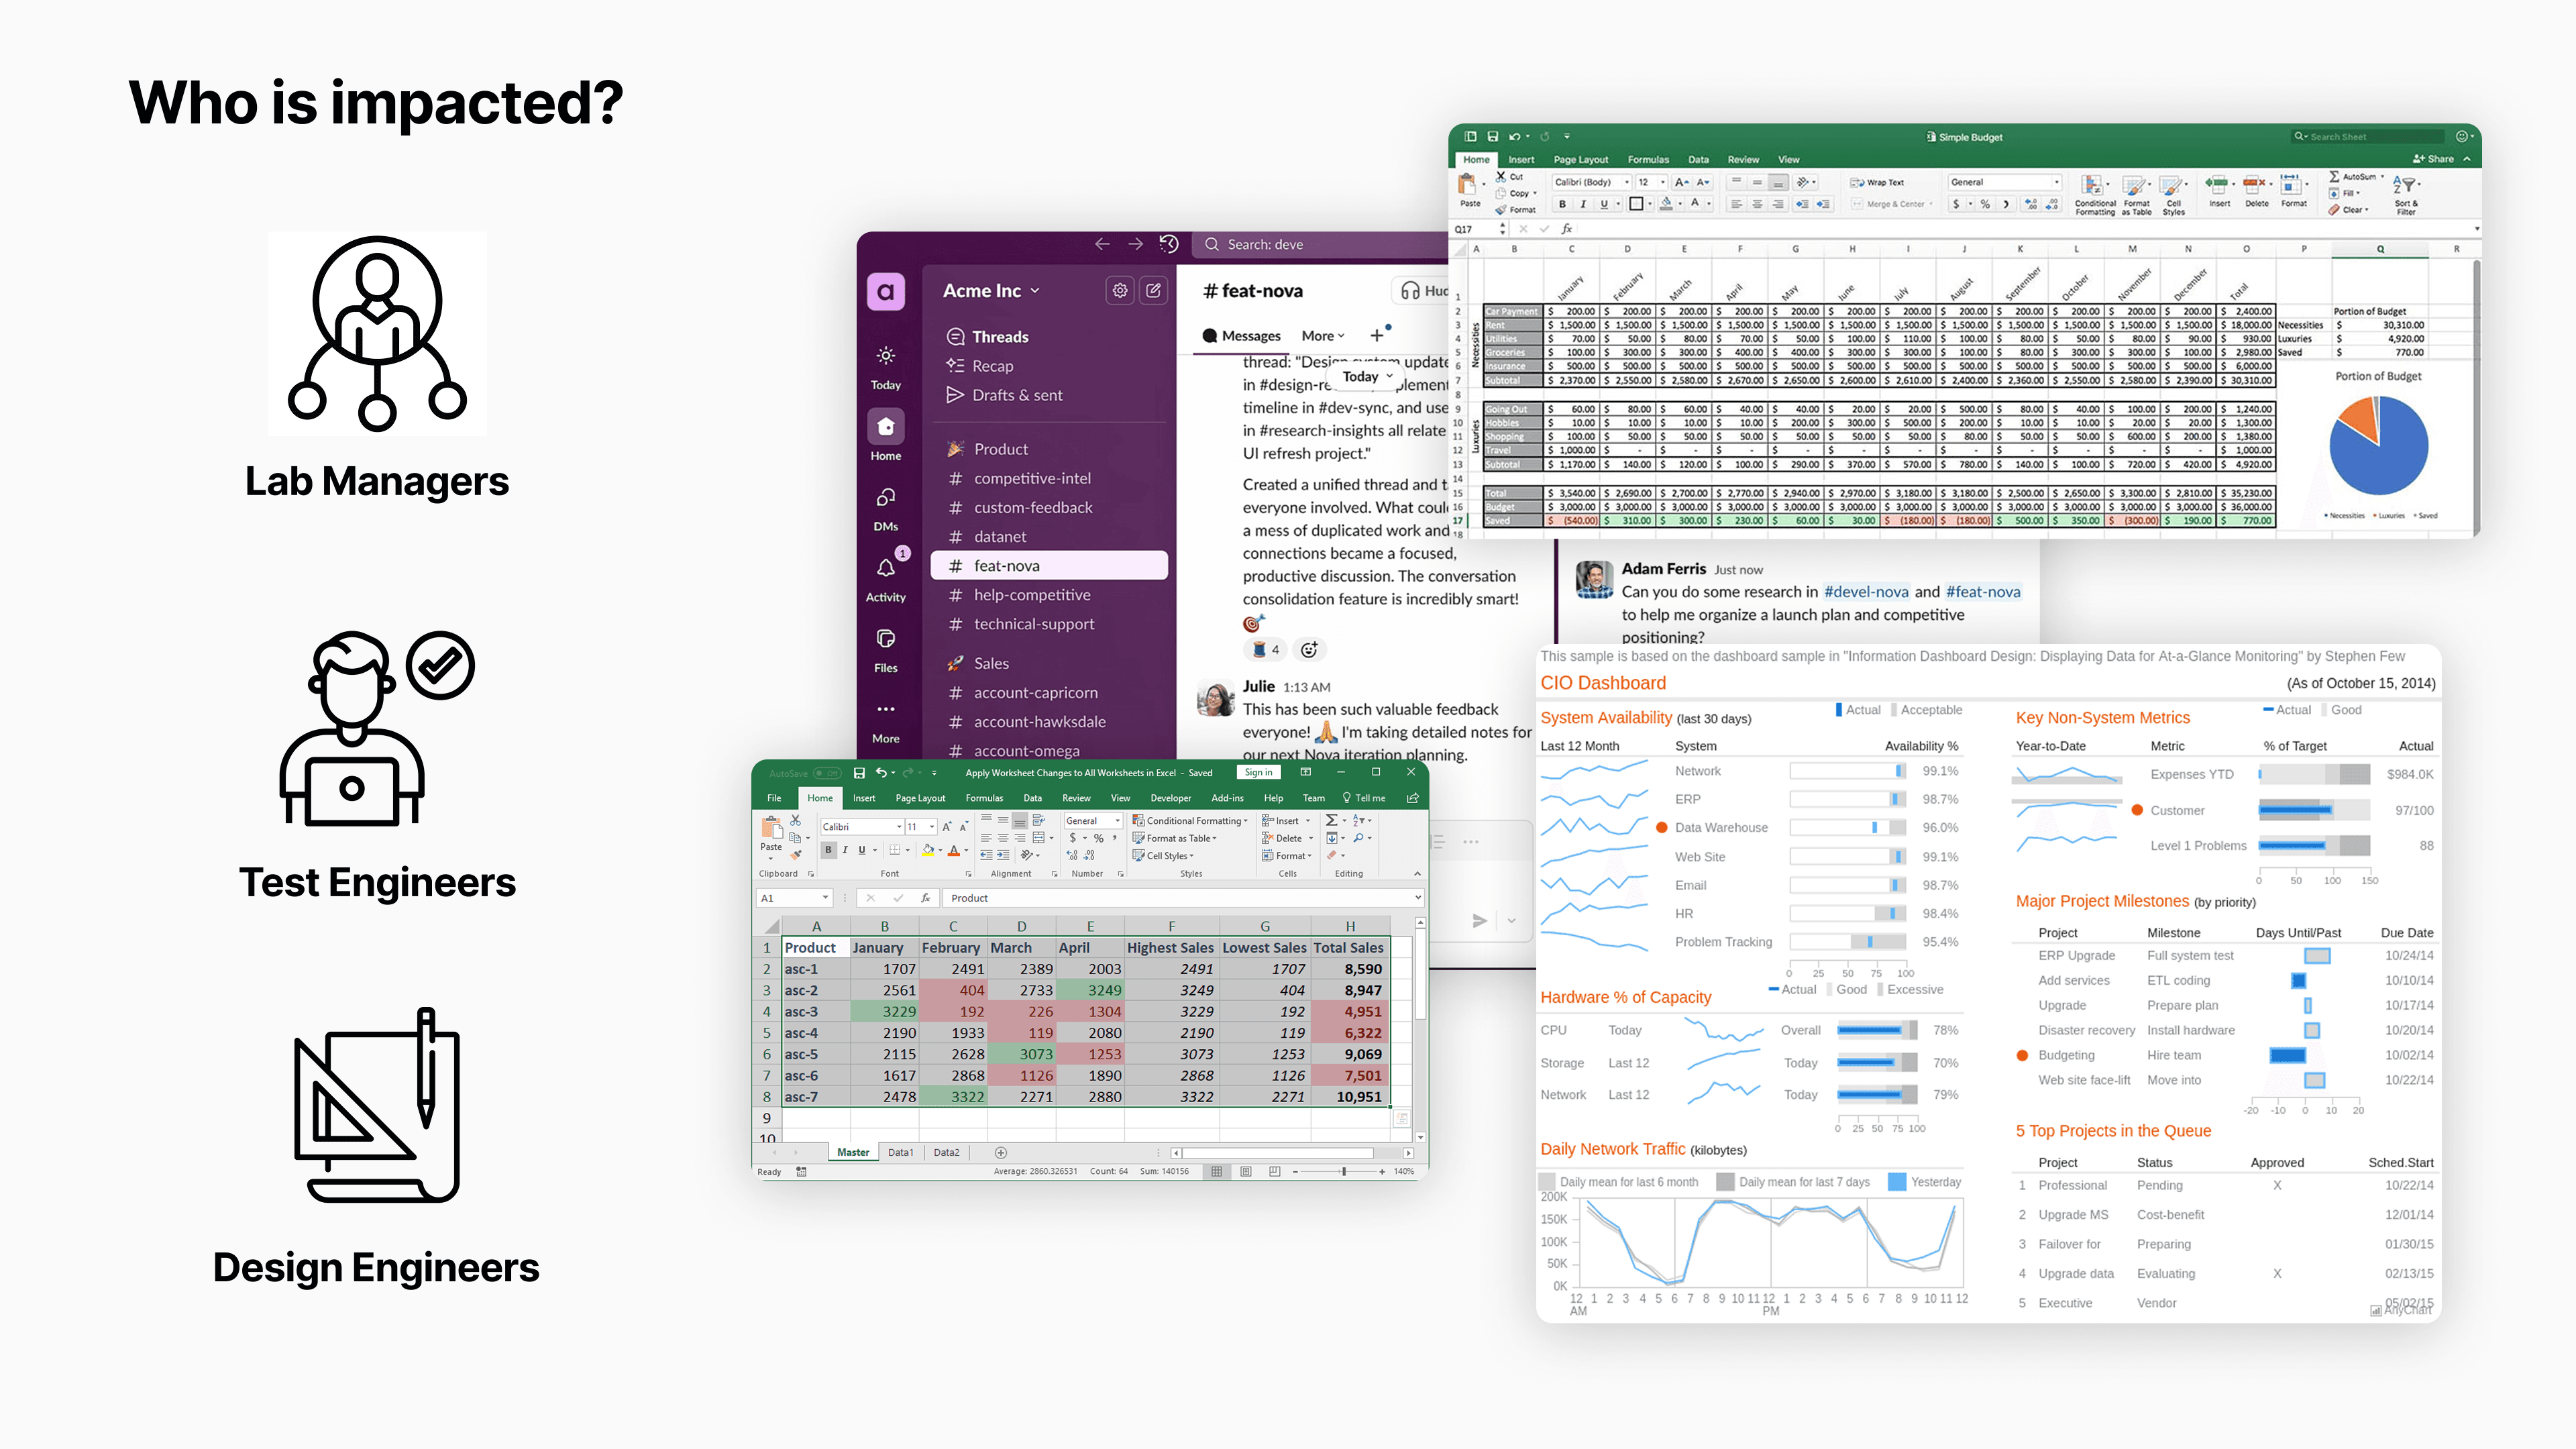
Users described switching across Excel sheets, Slack channels, email, dashboards, and self-made tools.
Research
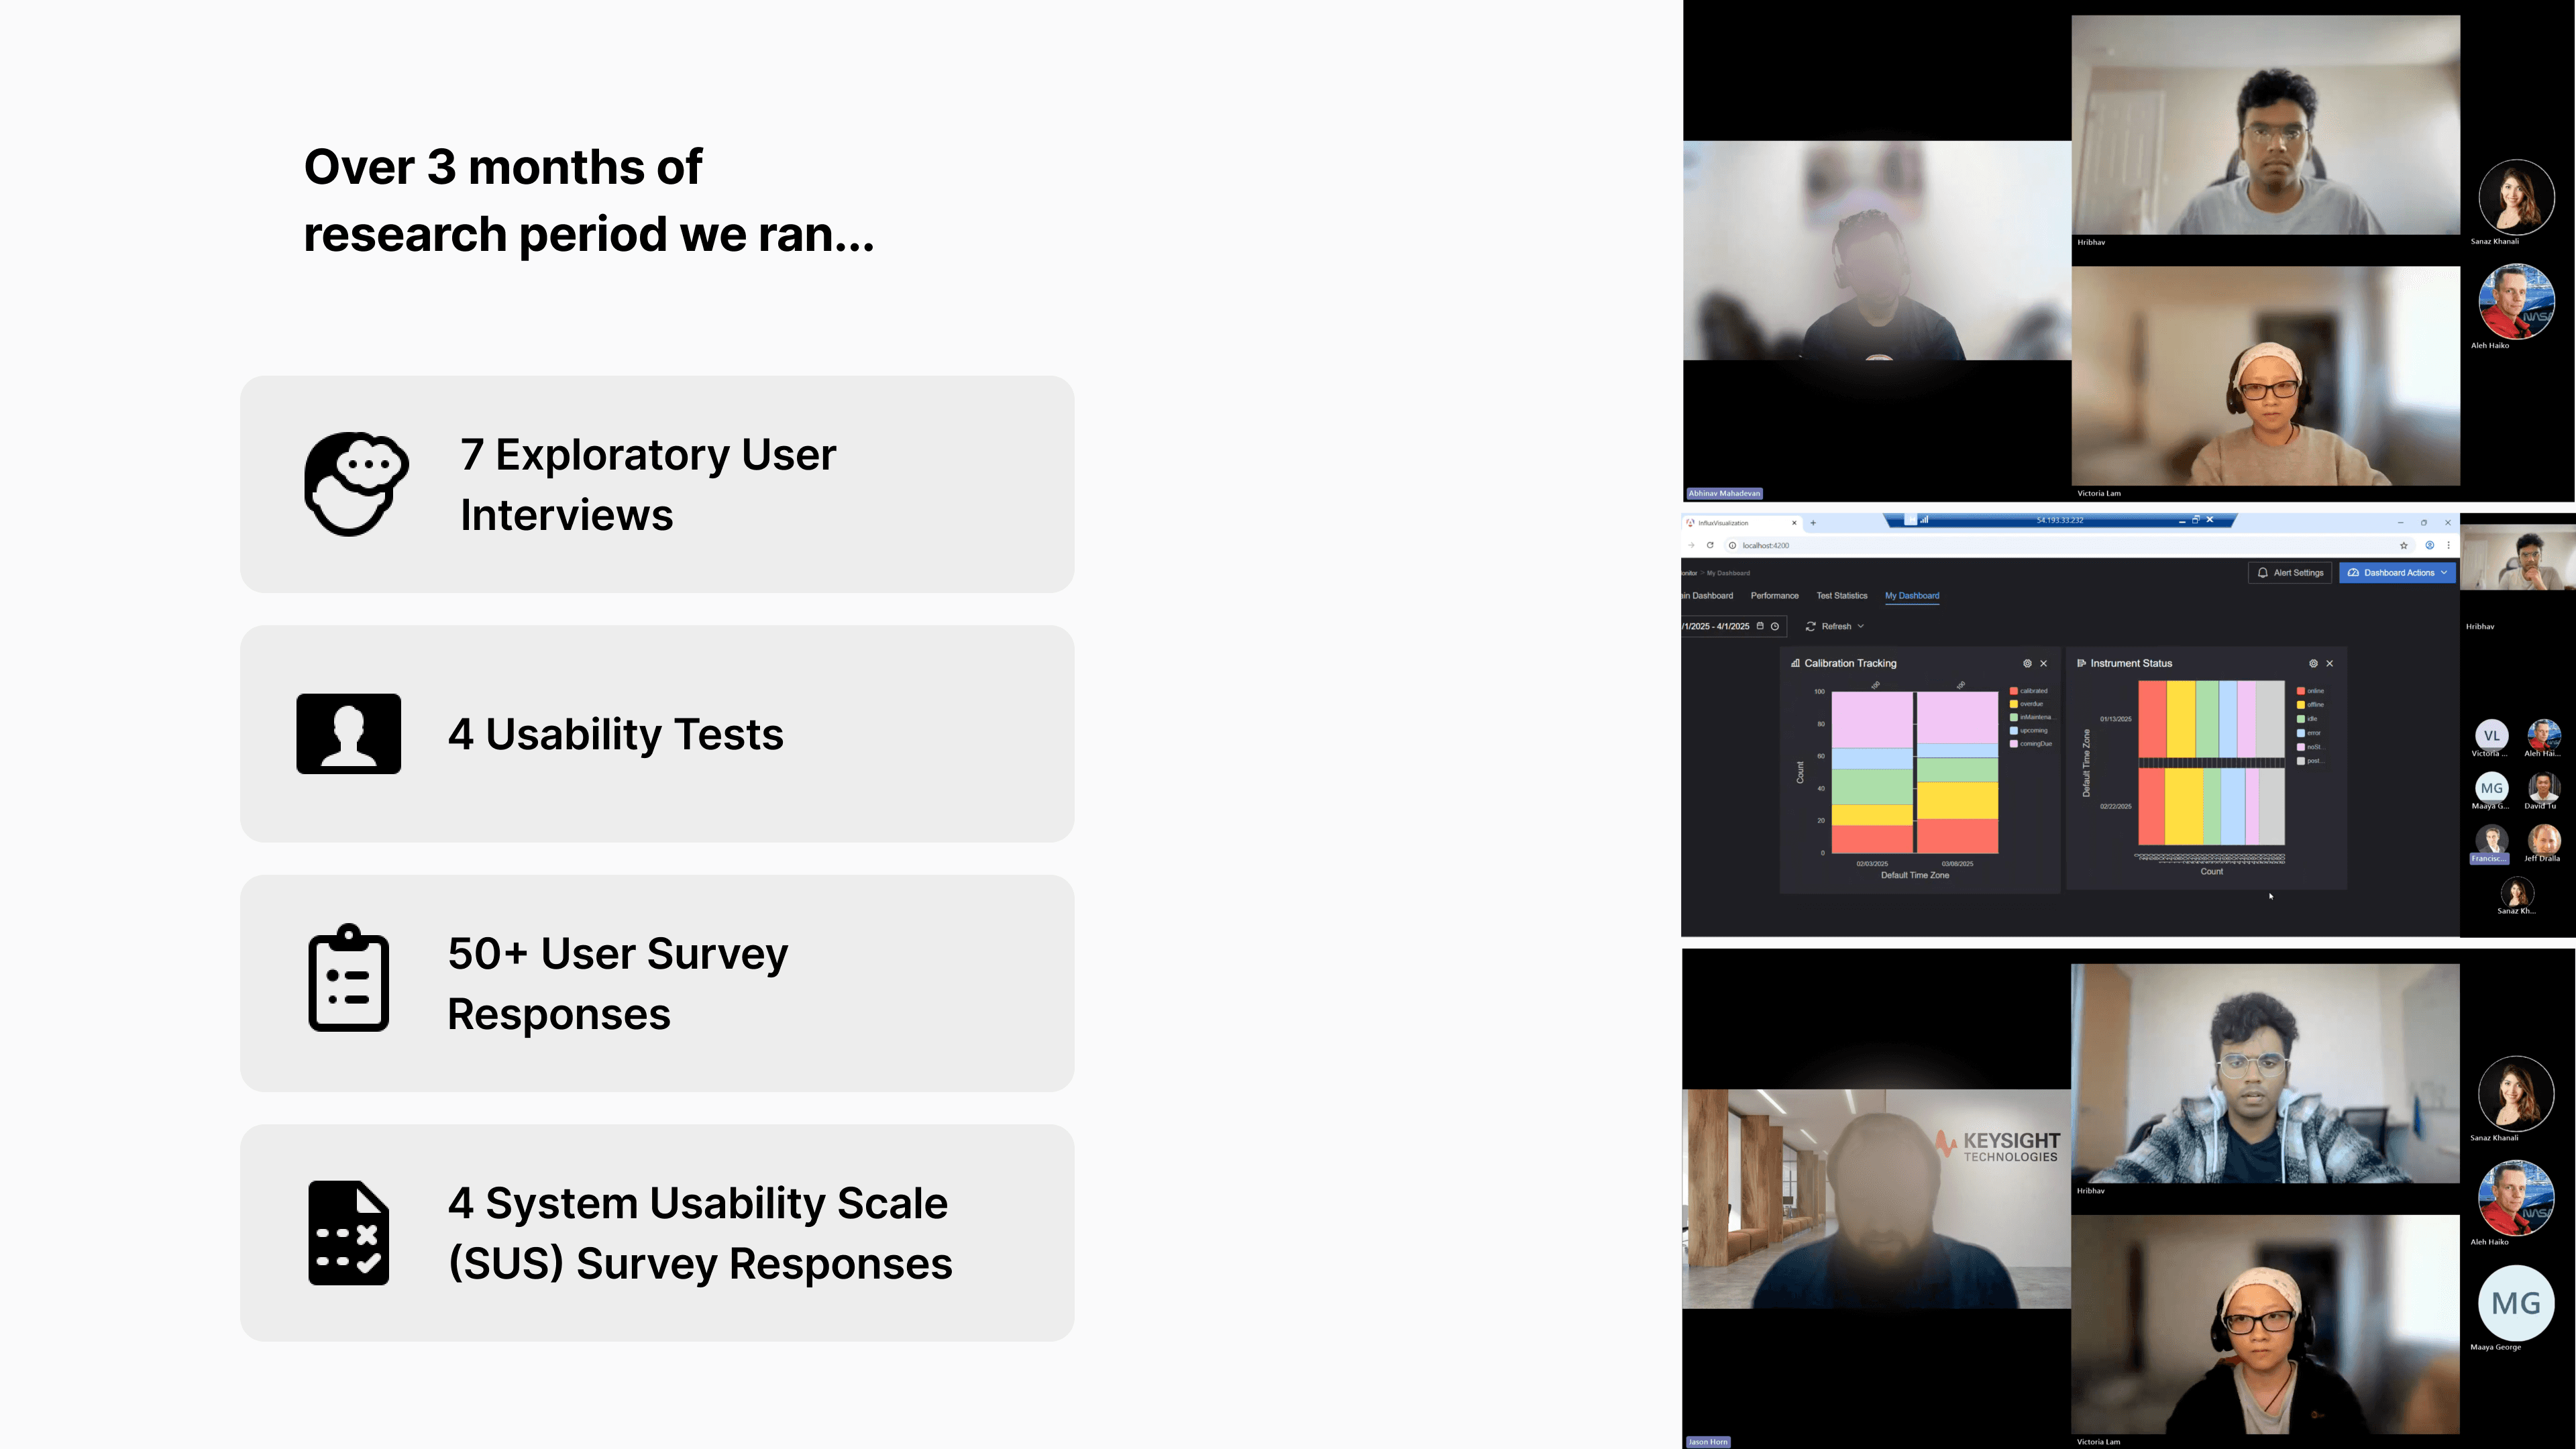
I led UX strategy and research to align the dashboard with how teams actually make decisions.
I worked closely with test engineers, lab managers, and technical leads to understand how different roles used the dashboard under real production constraints. I planned and conducted stakeholder interviews, usability testing on the existing system, surveys, and workflow walkthroughs. This research helped map role-specific goals, decisions, and friction points, and directly informed how information should be surfaced and prioritized.
Research
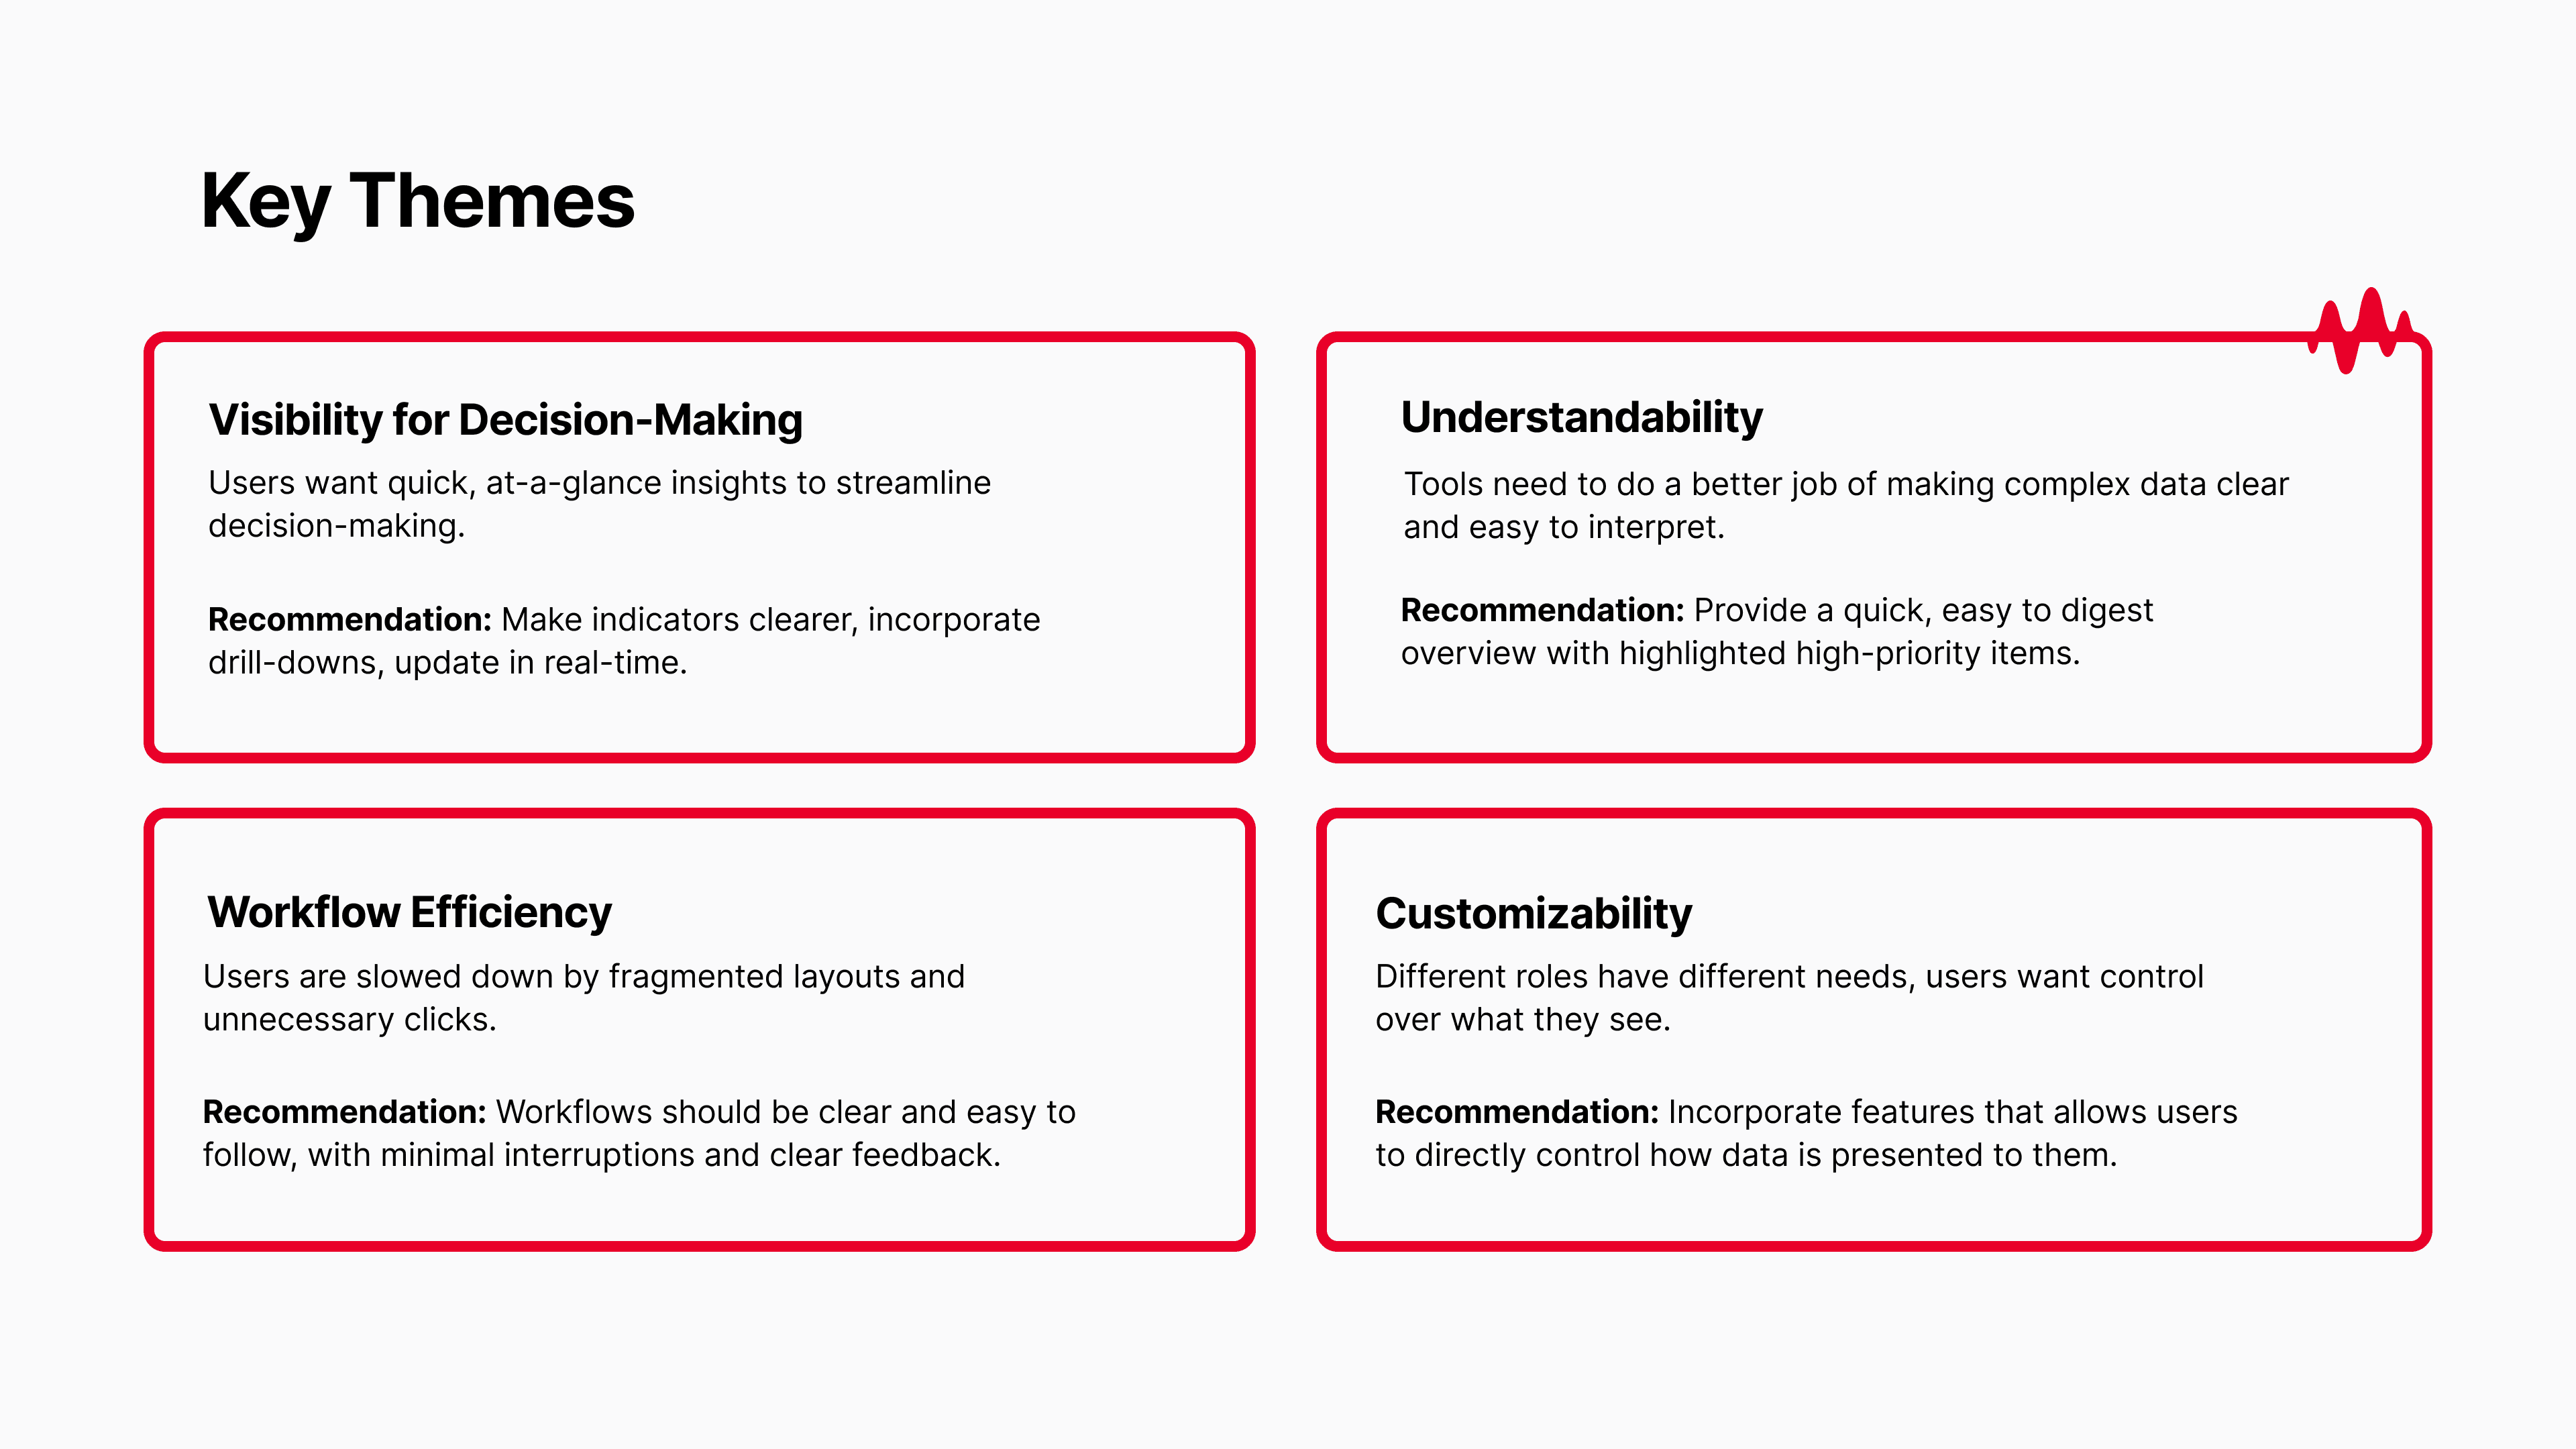
Interviews with lab managers, test engineers, and design leads revealed the same pattern.
Research
Teams already had the data, but they lacked visibility into what needed attention and clear guidance on what to do next.
They struggled to understand what metrics meant and how to act on them. Workflows were inefficient, and the system lacked flexibility to adapt views by role or context.
Ideation
These themes guided ideation and narrowed the solution space.
We clustered ideas around the four themes to avoid designing isolated features. Ideation sessions focused on how improvements could work together across workflows. This helped us move from scattered ideas to cohesive system-level concepts.
Ideation
The flow of Ideation is below
Ideation
Early concepts focused on a unified dashboard to bring everything into one place.

Challenge - Pivot
Usability tests on those concepts showed users already relied on similar dashboard experiences in Grafana and Tableau.

Challenge - Pivot
We reframed the question from “How do we consolidate the data?” to “How do we make this meaningfully better than the dashboards users already trust?”

Solution
Solution: AI assistance embedded directly into monitoring, interpretation, drill-down, and reporting unlocked faster clarity.

Impact
High-fidelity prototypes delivered a conservative 11.48% efficiency gain in analysis and reporting time.
In task-based usability tests, users completed end-to-end analysis and report creation 11.48% faster using the AI-assisted dashboard. The measurement covered time spent reviewing data, interpreting insights, and producing final reports.
Impact
The 11.48% gain showed promise, but also revealed clear areas for improvement.
Because the prototype used simulated data and loosely connected AI, users still needed to review and refine AI outputs manually. This re-iteration limited the efficiency lift. Deeper backend integration, more accurate pattern recognition on real datasets, and refined trust mechanisms would likely push gains significantly higher. Future work should also expand customizable templates and strengthen traceability for enterprise users.